5 Reasons to Use Recap.Dev
Arseny Yankovski
Lead Architect @ eMarketeerWhatever your application stack is, you will benefit from better observability of your system. Setting up tracing is probably one of the easiest ways of doing just that. At Recap.Dev, we strive to provide an easy way to improve application stability while providing a nice experience to our actual users - engineers of all sorts.
Let me walk you through a couple of main benefits I found while using Recap.Dev. Yes, we're using it ourselves.
You're the First One to Know When an Error Occurs#
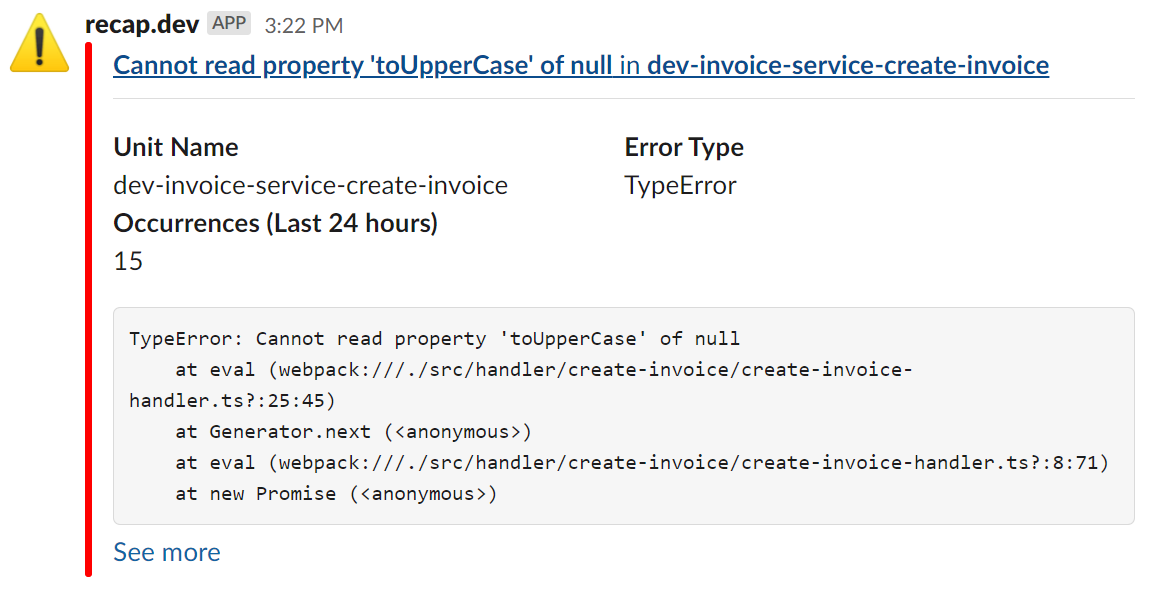
Let's face it: you're going to have errors in production. With our Slack integration, you can start fixing it immediately after it happened, bypassing the customer support and giving your support a heads up. Being proactive here means less downtime and happier customers.
We're firm believers in the sane defaults. Of course, Recap.Dev won't message you every time you have an error in your system. It will report an error not more often than every 5 minutes and send the frequency of occurrences along.

It's Easy to Start Using Recap.Dev#
Every time we provide a wrapper for new technology, we try to use all of its features. Our goal is to spend more time writing the code so that you spend less time integrating Recap.Dev.
We try to support as many technologies as we can, but writing a good wrapper takes time. We are trying to focus on Node.js-based applications right now. Check here for a list of currently supported technologies.
You can always contact us if your favorite framework is not supported!
Easier Debugging and Performance Optimizations#
It's not always enough to see the stack trace to understand what the cause of the error is. Recap.Dev provides as much information as possible: request and response payloads, logs, and, most importantly, the timeline. The timeline shows the timings of each external resource request (database queries, HTTP requests, etc.) made. If you set the function-level tracing up, it will also include timings of individual functions. You could expand each resource request to see detailed information.
With that kind of timeline, you'll save a ton of time while debugging or trying to reproduce the issue.
Many times when my Serverless Function timed out, I'd have to write a special instrumentation code and try to reproduce the issue. The timeline will show a silly mistake I made and how much execution time it costs. Doing SQL queries in a loop instead of one batch query? Recap.Dev's timeline will show that.
I should probably make these API calls fire in parallel.
A Searchable Log of Your System's Operations#
When all of your system's invocations are recorded, it's easy to find a particular one and understand what happened. Think of it as an advanced log of your application's operations. Customer Support needs to look up a result of a particular operation? We got you covered. Read more on the topic here.

It's easy to find a trace by a log message.
A Helicopter View of Your System#

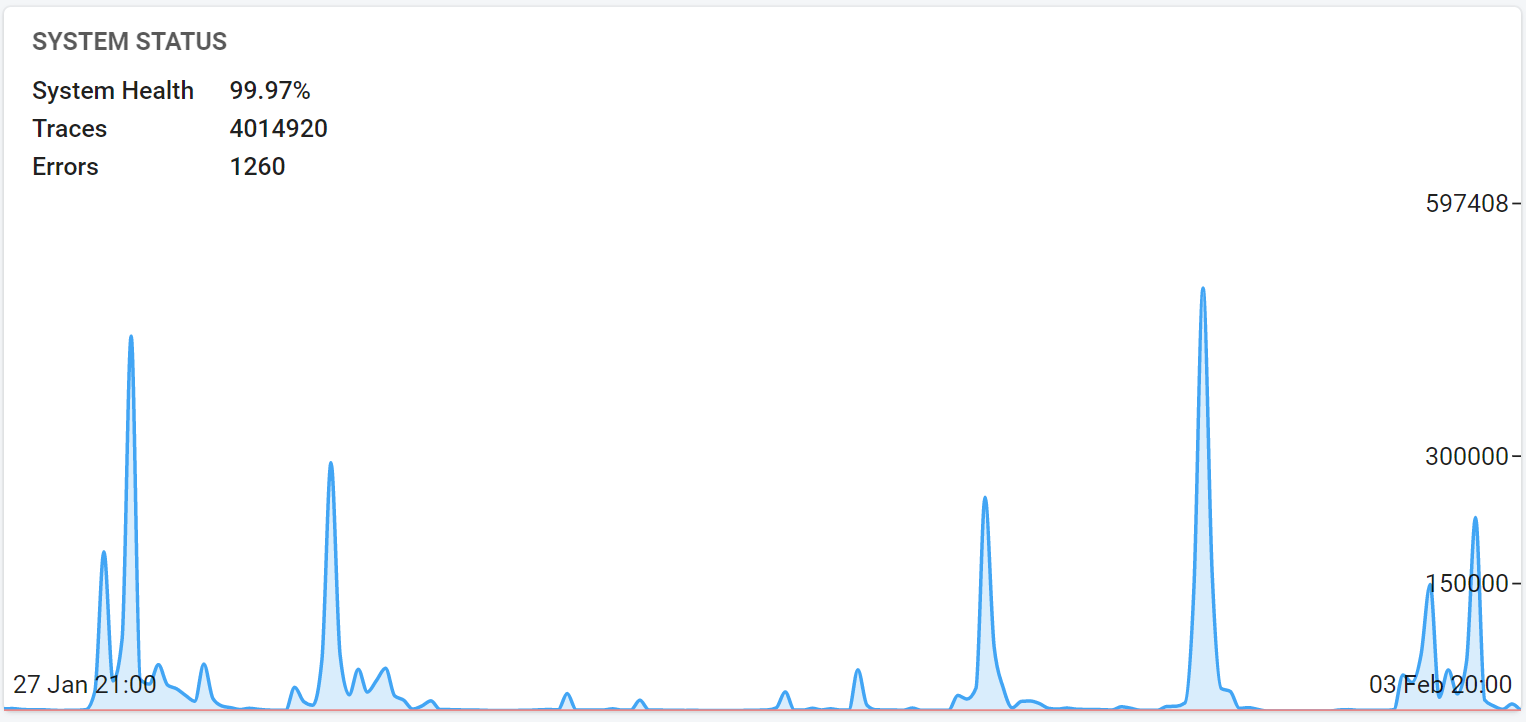
As a cherry on the top of a cake, Recap.Dev will also aggregate stats to give you the general impression of a system load and health. It also provides helpful insights about your system, like one endpoint failing too often.