Recap.Dev Now Supports Tracing Vercel Functions and Netlify Functions
Arseny Yankovski
Lead Architect @ eMarketeerVercel and Netlify functions are some of the most popular solutions when it comes to the Jamstack backend.
In a survey conducted by O'Reilly in June 2019, 30% of the respondents named harder debugging, and 25% named observability to be the biggest challenges in adopting serverless technologies. In the same report, about 17% mentioned a lack of tools. It's not always easy to debug serverless applications.
If you're using Vercel or Netlify functions, it's even more challenging because there are even fewer tools available. No tracing tool supports these serverless platforms out of the box.
That's why we just released a new 1.12.0 version of the Recap.Dev JavaScript client, which exports two new wrapper functions: wrapNetlifyHandler and wrapVercelHandler.
This allows tracing the Netlify Functions and the Vercel Functions serverless providers, respectively.
Existing solutions and integrations only allow for log analysis. Don't get me wrong, it's a great and non-intrusive technique, but sometimes seeing logs is just not enough.
Better Observability#
Recap.Dev will collect and aggregate statistics across your functions to provide you an understanding of each function's state. It will also aggregate system-wide stats to give you a sense of your system's load and health.
Based on these stats, it will generate useful insights, so you immediately see the important stuff. An example insight is when a function fails in more than 1% of all invocations.
Easier Debugging#
Log analysis tools are good at collecting errors and alerting on them. What they're not good at is cases when you don't immediately see the root cause. Something is undefined or null when it's not supposed to be, but what has that SQL query that runs before returned?
That's what Recap.Dev excels at. It will always provide request and response payloads, so it's easier to reproduce the issue. Recap.Dev also records all external operations like database queries or API calls and their results, so you might not even need to reproduce the issue and immediately make out how to fix it.
Being the first to know about production errors and being faster at fixing them means happier customers. It's also good for engineers to spend less time fixing bugs and doing the actual work.
Easier Performance Optimizations#
Performance optimizations, for example, are painful when your only instrument is logging. Usually, you'll be adding some code ad-hoc to measure a specific piece of code. This approach doesn't work if you want to know which part of the code was slow during a request that already happened. An alternative is to always have some instrumentation logging, which will obviously clutter the logs.
Knowing which part of the code is slow becomes even more important in the serverless environment. Both Vercel and Netlify functions use AWS Lambda, which currently has a maximum timeout of 15 minutes.
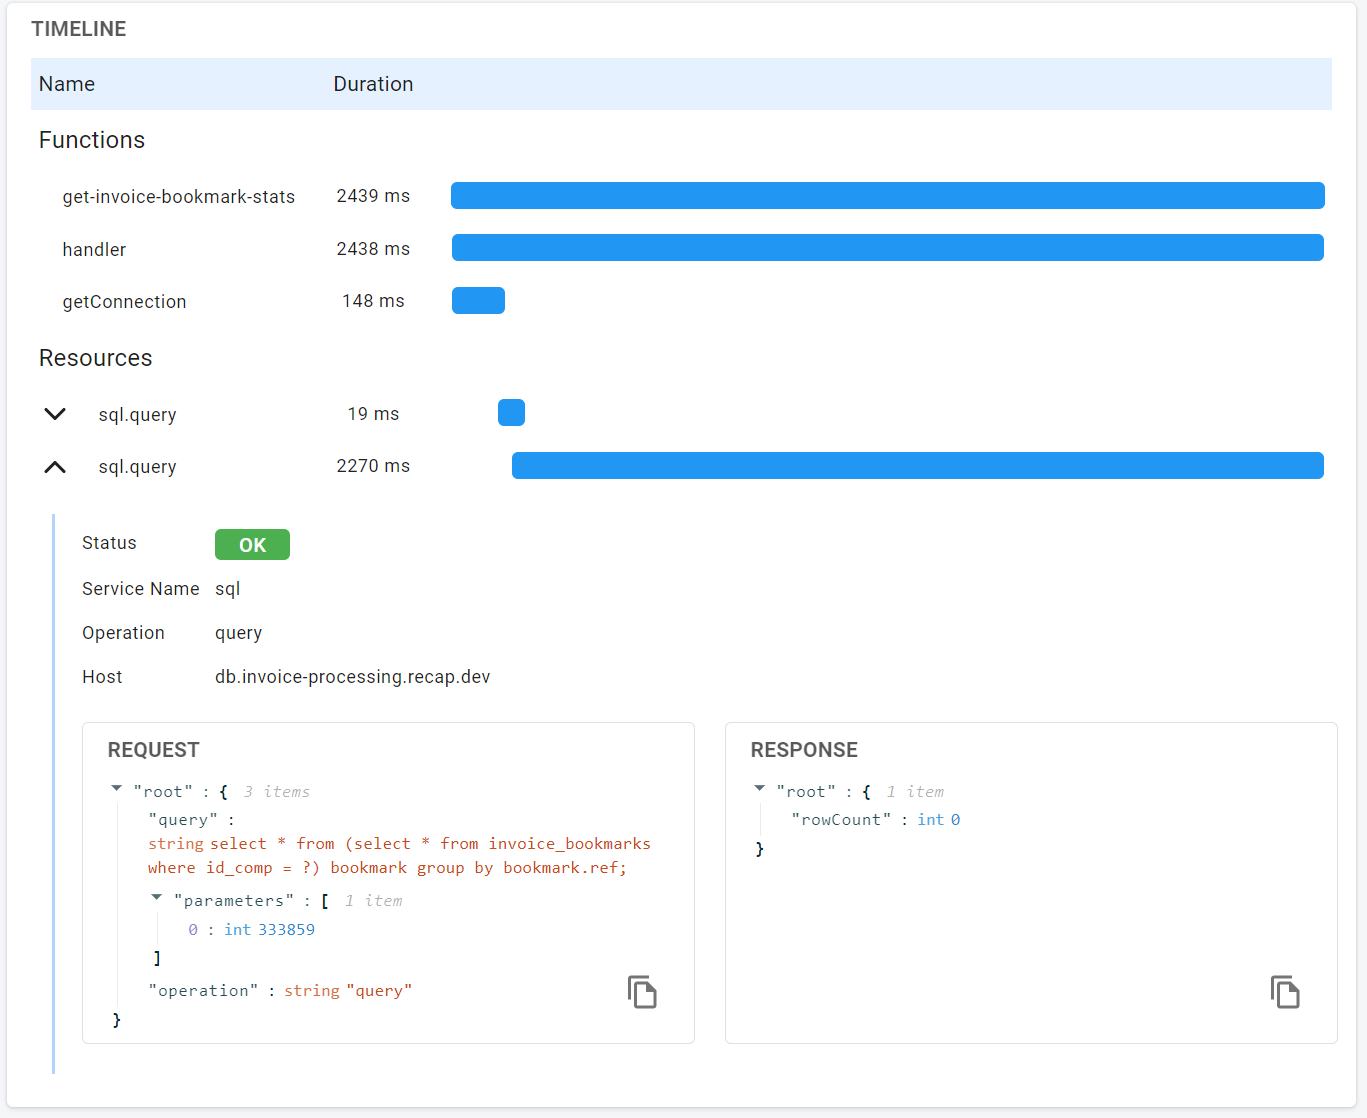
Recap.Dev gathers timings of all your external resource calls and timings of individual functions and methods and compiles it into an easy-to-understand timeline.

It's easy to find a bottleneck with the Recap.Dev timeline
Tracing your serverless functions with Recap.Dev provides you with essential information when debugging, especially a production issue. Recap.Dev also provides automatic alerts for the errors happening in your functions, so you're the first to know if something goes wrong. Adding Recap.Dev to your application won't take more than 5 minutes.